Key messages
- Industry contributes significantly to the United States’ (U.S.) greenhouse gas (GHG) emissions, and so it needs to be a key focus of U.S. climate policy
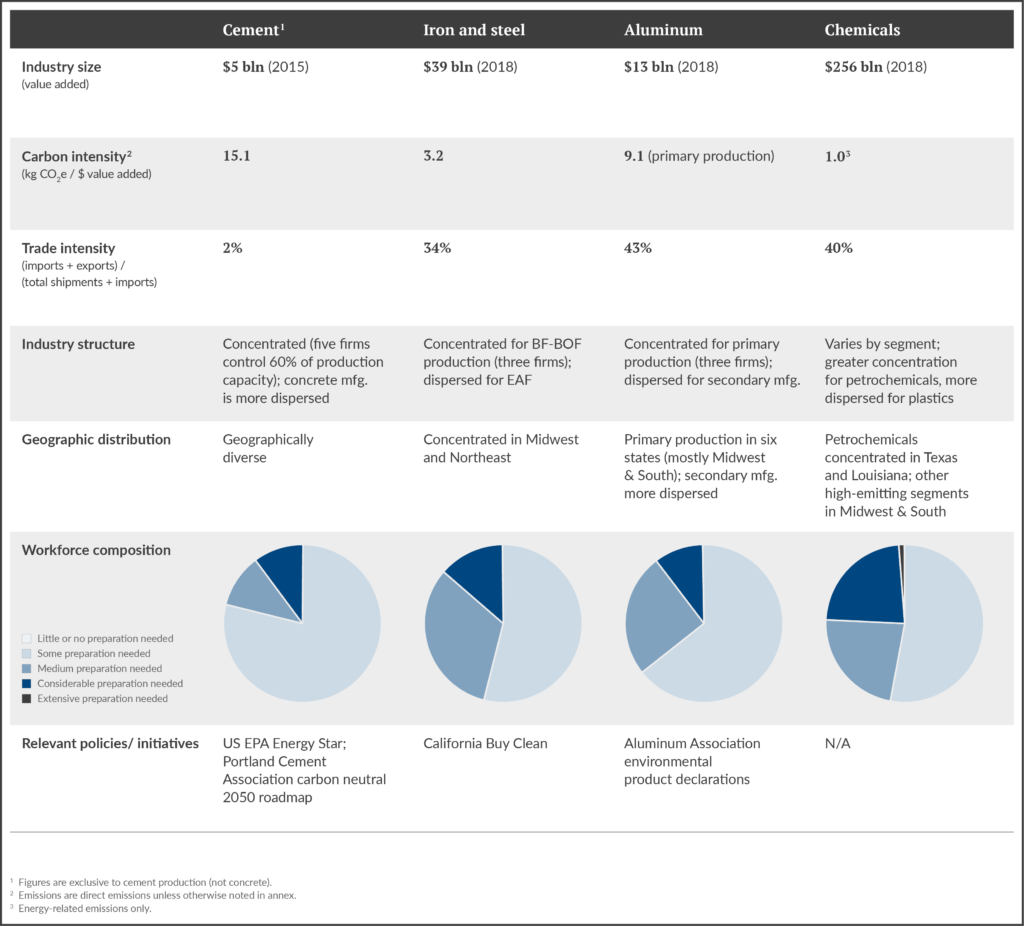
- Cement, iron and steel, aluminum and chemicals are some of the most carbon-intensive industries in the U.S., and will be critical for broader decarbonization efforts
- Deep decarbonization of industry will require deliberate collaboration between the private and public sectors. For the U.S., a multi-level approach involving coordinated state and federal action, in partnership with industries, will be essential for successful industry transitions
Industrial emissions as a key element of U.S. climate policy
As the world’s largest economy, the U.S. will be an essential player in global efforts to address climate change. One fifth of the total economic output for the U.S. comes from industry, an amount that comprises 10% of the value of all industrial output globally. Within heavy industries, the U.S. is among the largest producers of chemicals, the third largest producer of cement, the fourth largest producer of steel, and the ninth largest producer of aluminum.
Industry contributes significantly to U.S. greenhouse gas (GHG) emissions, mirroring its contribution globally. In 2018, 22% of total U.S. GHG emissions were attributable to industrial production. If one considers industrial emissions associated with all goods and services consumed in the U.S. – including imports – the total rises to 37%.
Tackling industrial emissions will therefore need to be a key element of U.S. climate policy. Furthermore, the resources that U.S. industry can bring to bear – including financial resources, technical knowledge, research capacity, and workforce skills – make it potentially a global leader for industrial decarbonization. Pioneering policy approaches, technical advances, and demonstration projects in the U.S. could help enable industrial transitions throughout the world.
Realizing this vision will require concerted, collaborative efforts between the U.S. public and private sectors. In a number of countries, such public-private partnerships are already taking shape. In the U.S., a key to success will be establishing such partnerships at both federal and state levels of government. This brief explores four important carbon-intensive industries in the U.S. – cement, iron and steel, aluminum, and chemicals – and discusses the key U.S. policy and governance considerations for achieving their decarbonization.
Heavy industry in the U.S.
Engaging with the four important “hard-to-abate” industries in the U.S. – cement, iron and steel, aluminium, and chemicals – will be critical for any effort to decarbonize U.S. industry. They differ in their size, carbon intensity, trade exposure, workforce composition, and – importantly – geographic distribution (see Table 1 below). They also differ in the extent to which existing policies and initiatives – federal, state, and voluntary – are already driving lower-carbon modes of production. A detailed overview of each of these industries is provided in the PDF.
Cement and concrete
The U.S. is the world’s third largest producer of cement and stands out for having the most carbon-intensive production in the world; in 2015, over 800 kg of CO2 were emitted per metric tonne of cement produced. Cement production accounts for around 10% of total direct emissions from the U.S. manufacturing sector. Though it is a challenge to decarbonize, the U.S. cement and concrete industry is not highly trade exposed and is geographically more distributed than other heavy industries.
Iron and steel
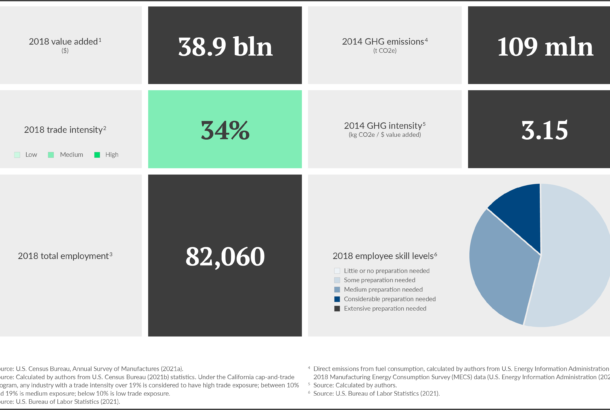
The U.S. is the world’s fourth largest steel producer, and the largest importer of steel. Iron, steel, and ferroalloy manufacturing is one of the highest carbon-emitting industries in the country due to a reliance on fossil-fuel intensive production pathways; however, U.S. iron and steel production is still lower emitting than in most other countries. Geographically, U.S. iron and steel production is fairly concentrated, primarily in the Midwest and Northeast. The industry is highly trade exposed, a key consideration for any decarbonization strategy. The industry’s workforce is skilled relative to other industries, with about 45 % of the employees requiring qualifications beyond a high school diploma in 2018.
Aluminum
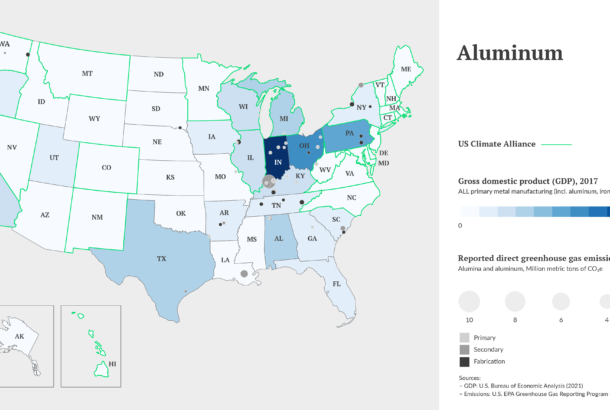
U.S. aluminum production has declined significantly over the past two decades, but in 2019 the U.S. was still the world’s ninth largest producer. Production is highly energy-intensive, with electricity constituting a large component of production costs. As a result, primary smelters have typically been located in parts of the country with lower electricity prices, including coal-fired power in the Midwest and Southeast. Secondary aluminum production, which relies on recycled aluminum, is much less electricity-intensive and is more geographically distributed. The industry is highly trade exposed, with primary aluminum manufacturers relying almost exclusively on imports for raw material (primarily bauxite). Primary production is also a highly concentrated industry, with only three companies – Alcoa, Century Aluminum, and Magnitude 7 Metals – operating smelters in six states.
Chemicals
The U.S. is the second largest chemical producer in the world, producing a wide array of both intermediate and final products used in goods and services throughout the economy. Most chemical products are derived from fossil fuel feedstocks, with petrochemicals at the base of a wide range of supply chains. The industry is also energy intensive, with energy consumption producing approximately 260 million metric tons of CO2 emissions in 2018. Though somewhat diverse geographically, the greatest concentrations of chemical manufacturing facilities are in California, Texas, Ohio, Illinois, and Pennsylvania. Texas and Louisiana account for around 70% of all primary petrochemical production. The chemicals industry as a whole is trade exposed but has a relatively skilled workforce, especially in basic chemicals.
Collaboration, cooperation and synergy
A global consensus is emerging that deep decarbonization of industry will require deliberate collaboration between the private and public sectors, with industries and regulators working together on a common vision for research, policy measures, and investment over the long term (Åhman 2020; Dell 2020; Nykvist et al. 2020; Whitlock et al. 2020; ETC 2018).
The U.S. has seen few such collaborative approaches in the recent past, at least at the national level. For decades, both industry and federal policymakers resisted any kind of formal “industrial policy,” defaulting instead to less coherent and more opaque forms of industry-focused economic policy (Bernstein 2020; Ketels 2007; Wade 2014). The picture is more nuanced, however, at state and local levels, where various initiatives to develop commercial and industrial economic “clusters” have had real success (Baily and Montalbano 2018; National Research Council 2012). These include efforts to promote collaboration between academia, businesses, civil society, and policymakers around sustainably growing and decarbonizing specific industries.
Washington State’s “Maritime Blue Strategy,” for example, seeks to deliberately grow the state’s maritime economy on the basis of clean technology innovation, workforce development, and economic competitiveness, through active partnerships among public entities, maritime businesses, academic and research institutions, ports, labor groups, and community organizations (Department of Commerce 2019). Multiple states have also adopted multi-sector energy strategies laying out long-term plans for decarbonization and economic growth. Similarly, comprehensive and long-term strategies must be implemented in all U.S. industries, including the “hard to abate” sectors.
The need for multi-level engagement
As the federal government once again looks ready to renew and redouble its commitment to addressing climate change, it is important to appreciate that the scale and pace of transformation needed to decarbonize U.S. industry by the middle of this century will make national-level action and coordination essential. States cannot match the federal government’s capacity to support research and development, help bring new technologies to commercial viability, and drive widescale and rapid deployment of low-carbon technologies and practices. Only the federal government can ensure a level playing field for industries, between states and among international competitors, as transitions progress. If large-scale, “wartime” mobilization of investment is needed to decarbonize quickly – including, for example, through direct contracting (Dell 2020) – federal action is needed.
At the same time, the unique and complementary roles of state governments should not be overlooked. When it comes to policy support, industry engagement, and the coordination of stakeholders (including labor groups and civil society) needed to realize a successful transition, state governments have distinct comparative advantages. States are well-positioned to drive markets for low-carbon materials through state-level procurement and clean product standards, such as California’s ”Buy Clean Act” for building materials. They will also be key players in efforts to build and upgrade infrastructure (e.g., providing clean electricity), invest in workforce development, and ensure local environmental protection. Moreover, state governments are particularly suited to oversee and implement collaborative approaches that bring together the stakeholders needed for rapid and successful transitions.
In addition, when it comes to sustained and long-term policy commitments, states arguably have more staying power. U.S. federal climate policy has, unfortunately, been subject to changing political priorities. Not all states have committed to climate action, but those that have typically possess strong and sustained track records. The 25 states that form the U.S. Climate Alliance, for example, have long-standing policies supporting clean energy, energy efficiency, and sustainable transportation. These states have also committed to furthering those policies in support of the U.S. pledge to reduce emissions under the 2015 Paris Agreement. The strong interest these state governments have in developing clean, sustainable industries can act as an insurance policy against potential federal policy changes.
The right level of policy engagement is not a matter of “either/or”; rather, both federal and state-level action will be essential for rapid and successful industry decarbonization. Existing state-level industry initiatives have often had federal support; Washington State’s Maritime Blue Strategy, for example, was initially supported by a grant from the U.S. Department of Commerce. Rather, any roadmap for industry transition in the U.S. should be consciously multi-level in its approach.
A more detailed analysis of the four industries.
Carbon intensity
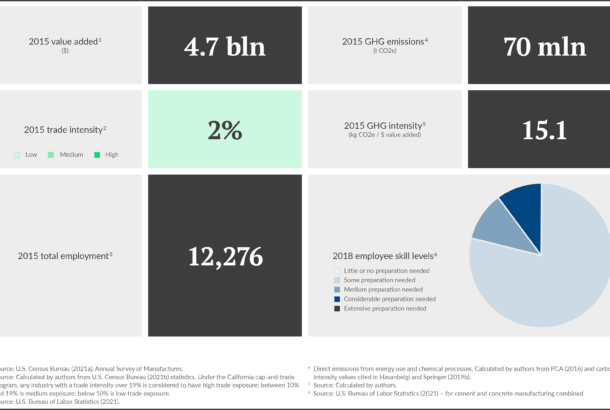
U.S. cement production stands out for having, on average, the highest carbon intensity in the world (Hasanbeigi and Springer 2019b). This is in part due to the high clinker-to-cement ratios used in U.S. cement plants. Unlike other parts of the world, blending with supplementary cementitious materials in the U.S. (which reduces overall carbon intensity) typically occurs at concrete mixing plants after the cement is produced. In 2015, over 800 kg of CO2 were emitted per metric tonne of cement produced (Hasanbeigi and Springer 2019b), equating to 15.1 kg CO2 per dollar of value added. Cement production accounts for around 10% of total direct emissions from the U.S. manufacturing sector.
Figure 1. Cement
Trade intensity
U.S. cement manufacturing is not a trade exposed industry, reflecting the high cost of long-distance shipping. Total trade intensity in 2018 was only 2%. The value of exports is low (about 1% of total shipment value) (U.S. Census Bureau 2021b). More than 80% of exports go to North and Central America. Imports represent about 3-4% of the total value of shipments and come mainly from Asia (primarily China and the Republic of Korea), Canada, and Mexico (U.S. Census Bureau 2021b).
Interstate trade may be significant in some parts of the country; not every state has a cement plant, and (much more numerous) concrete manufacturers may compete for cement from different plants within a region. This could be a factor to consider in state-level approaches to industry decarbonization.
Industry structure, geographic distribution, and workforce composition
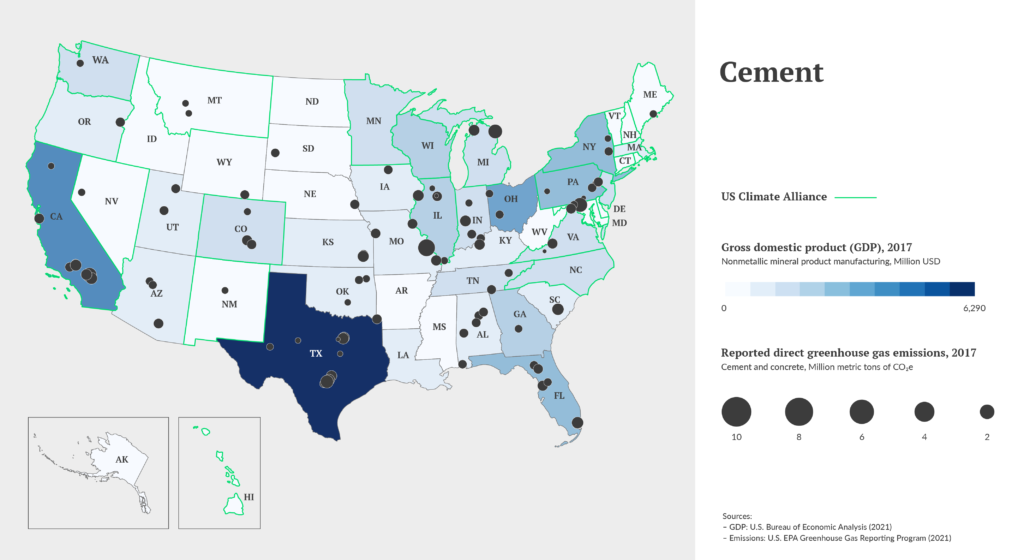
The cement industry is geographically dispersed, with cement plants in most U.S. states (Map 1). A total of 92 cement manufacturing facilities reported to the U.S EPA’s Greenhouse Gas Reporting Program for 2018. However, ownership is more concentrated, with 27 companies controlling all clinker production capacity (PCA 2016). Of these, the largest five firms – LafargeHolcim, CEMEX, Lehigh Hanson, Inc., Buzzi Unicem, Inc., and Ash Grove Cement Company – are responsible for nearly 60% of total production capacity (PCA 2016).
The geographic distribution of cement plants roughly reflects the distribution of U.S. population. In 2017, about 40% of the GDP for the nonmetallic mineral products sector (which includes cement and concrete production) was concentrated in six of the seven most populous states: 11% in Texas, 7% in California, 6% in Ohio, 5% in Pennsylvania, 5% in New York and 5% in Florida (the seventh, Illinois, is served by large cement producers in neighboring states) (U.S. Bureau of Economic Analysis 2021). California, Illinois, New York, and Pennsylvania are members of the U.S. Climate Alliance.
Cement and concrete manufacturing together employed around 185,000 employees in 2015. However, most of these workers were employed in concrete manufacturing,; only about 12,000 were employed directly in cement production. Across both cement and concrete manufacturing, required skill levels are relatively low; about 80% of the employees are classified as requiring “some preparation” (equivalent to a high school diploma). Required qualifications may be somewhat higher in cement production (data specific to cement are unavailable).
Map 1. Geographical distribution
Relevant U.S. policies and initiatives
Current policies in the U.S. largely consist of encouraging lower-carbon cement production through voluntary environmental product declarations. The U.S. EPA Energy Star program, for example, recognizes cement producers with superior energy performance (Krupnick 2020). The Portland Cement Association (the largest industry organization for cement producers in North America) is developing a roadmap “to facilitate its member companies achieving carbon neutrality across the concrete value chain by 2050,” which is expected to be completed by the end of 2021.
There is growing interest in green public-sector procurement policies to promote greater decarbonization of cement and concrete. Specifying use of blended cements, for example – either at cement plants or concrete batch plants – can significantly reduce overall carbon intensity. “Buy Clean” standards for concrete have been under consideration in New York and Washington State. Legislation to impose similar requirements at the federal level was introduced last year in the House of Representatives (Cavender 2020). The Biden Administration’s January Executive Order on climate change also calls for green procurement strategies, though these are not explicitly focused on cement and concrete or construction (The White House 2021).
Iron, Steel, and Ferroalloys
Carbon intensity
Steel production is highly energy and carbon-intensive. In 2014, the steel industry accounted for roughly 8% of the total fuel used in the U.S. manufacturing sector (Hasanbeigi and Springer 2019a), making it the third most energy-intensive manufacturing industry in the country (Krupnick 2020). Around one third of final energy used in iron and steel manufacturing is from natural gas. Another 25% comes from coke and breeze, which contributes to the industry’s high carbon intensity.
That said, U.S. iron and steel production is less carbon-intensive than in most other countries. Of the 87 Mt produced in 2018, 33% was produced by blast furnace and basic oxygen furnace (BF-BOF) and 67% by the electric arc furnace (EAF) route (Hasanbeigi and Springer 2019a). The EAF process is significantly less carbon emitting, in part because of its high reliance on recycled steel (Krupnick 2020). Around 86% of steel produced in the U.S. is recycled (Whitlock et al. 2020). A benchmark study of the steel industry involving 15 major steel-producing countries ranked the U.S. steel industry’s final energy and CO2 intensity as the fourth lowest (Hasanbeigi and Springer 2019a). The main reasons for this are the higher share of EAF steel production and the relatively high use of natural gas by U.S. steel manufacturers compared to other countries.
Trade intensity
The U.S. plays a significant role in the global steel trade. In particular, it is the largest importer of steel in the world, with most imports having a higher carbon intensity than domestic production (Hasanbeigi and Springer 2019a). For iron, steel, and ferroalloys combined, imports amounted to 34% of the total value of shipments from domestic producers in 2018.12 Exports are also significant, equal to 13% of the value of the sector’s total shipments in that year. This qualifies the industry as “highly” trade exposed, with a trade intensity of 34%.
Figure 2. Iron, Steel and Ferroalloys
Industry structure, geographic distribution, and workforce composition
In 2017, the value added of primary metal manufacturing in the U.S. was concentrated in several Midwest and Northeast states, especially in Indiana (15%), Ohio (10%), Pennsylvania (9%) and Michigan (5%) (Figure 2). Pennsylvania and Michigan are part of the U.S. Climate Alliance.
Map 2. Geographic distribution
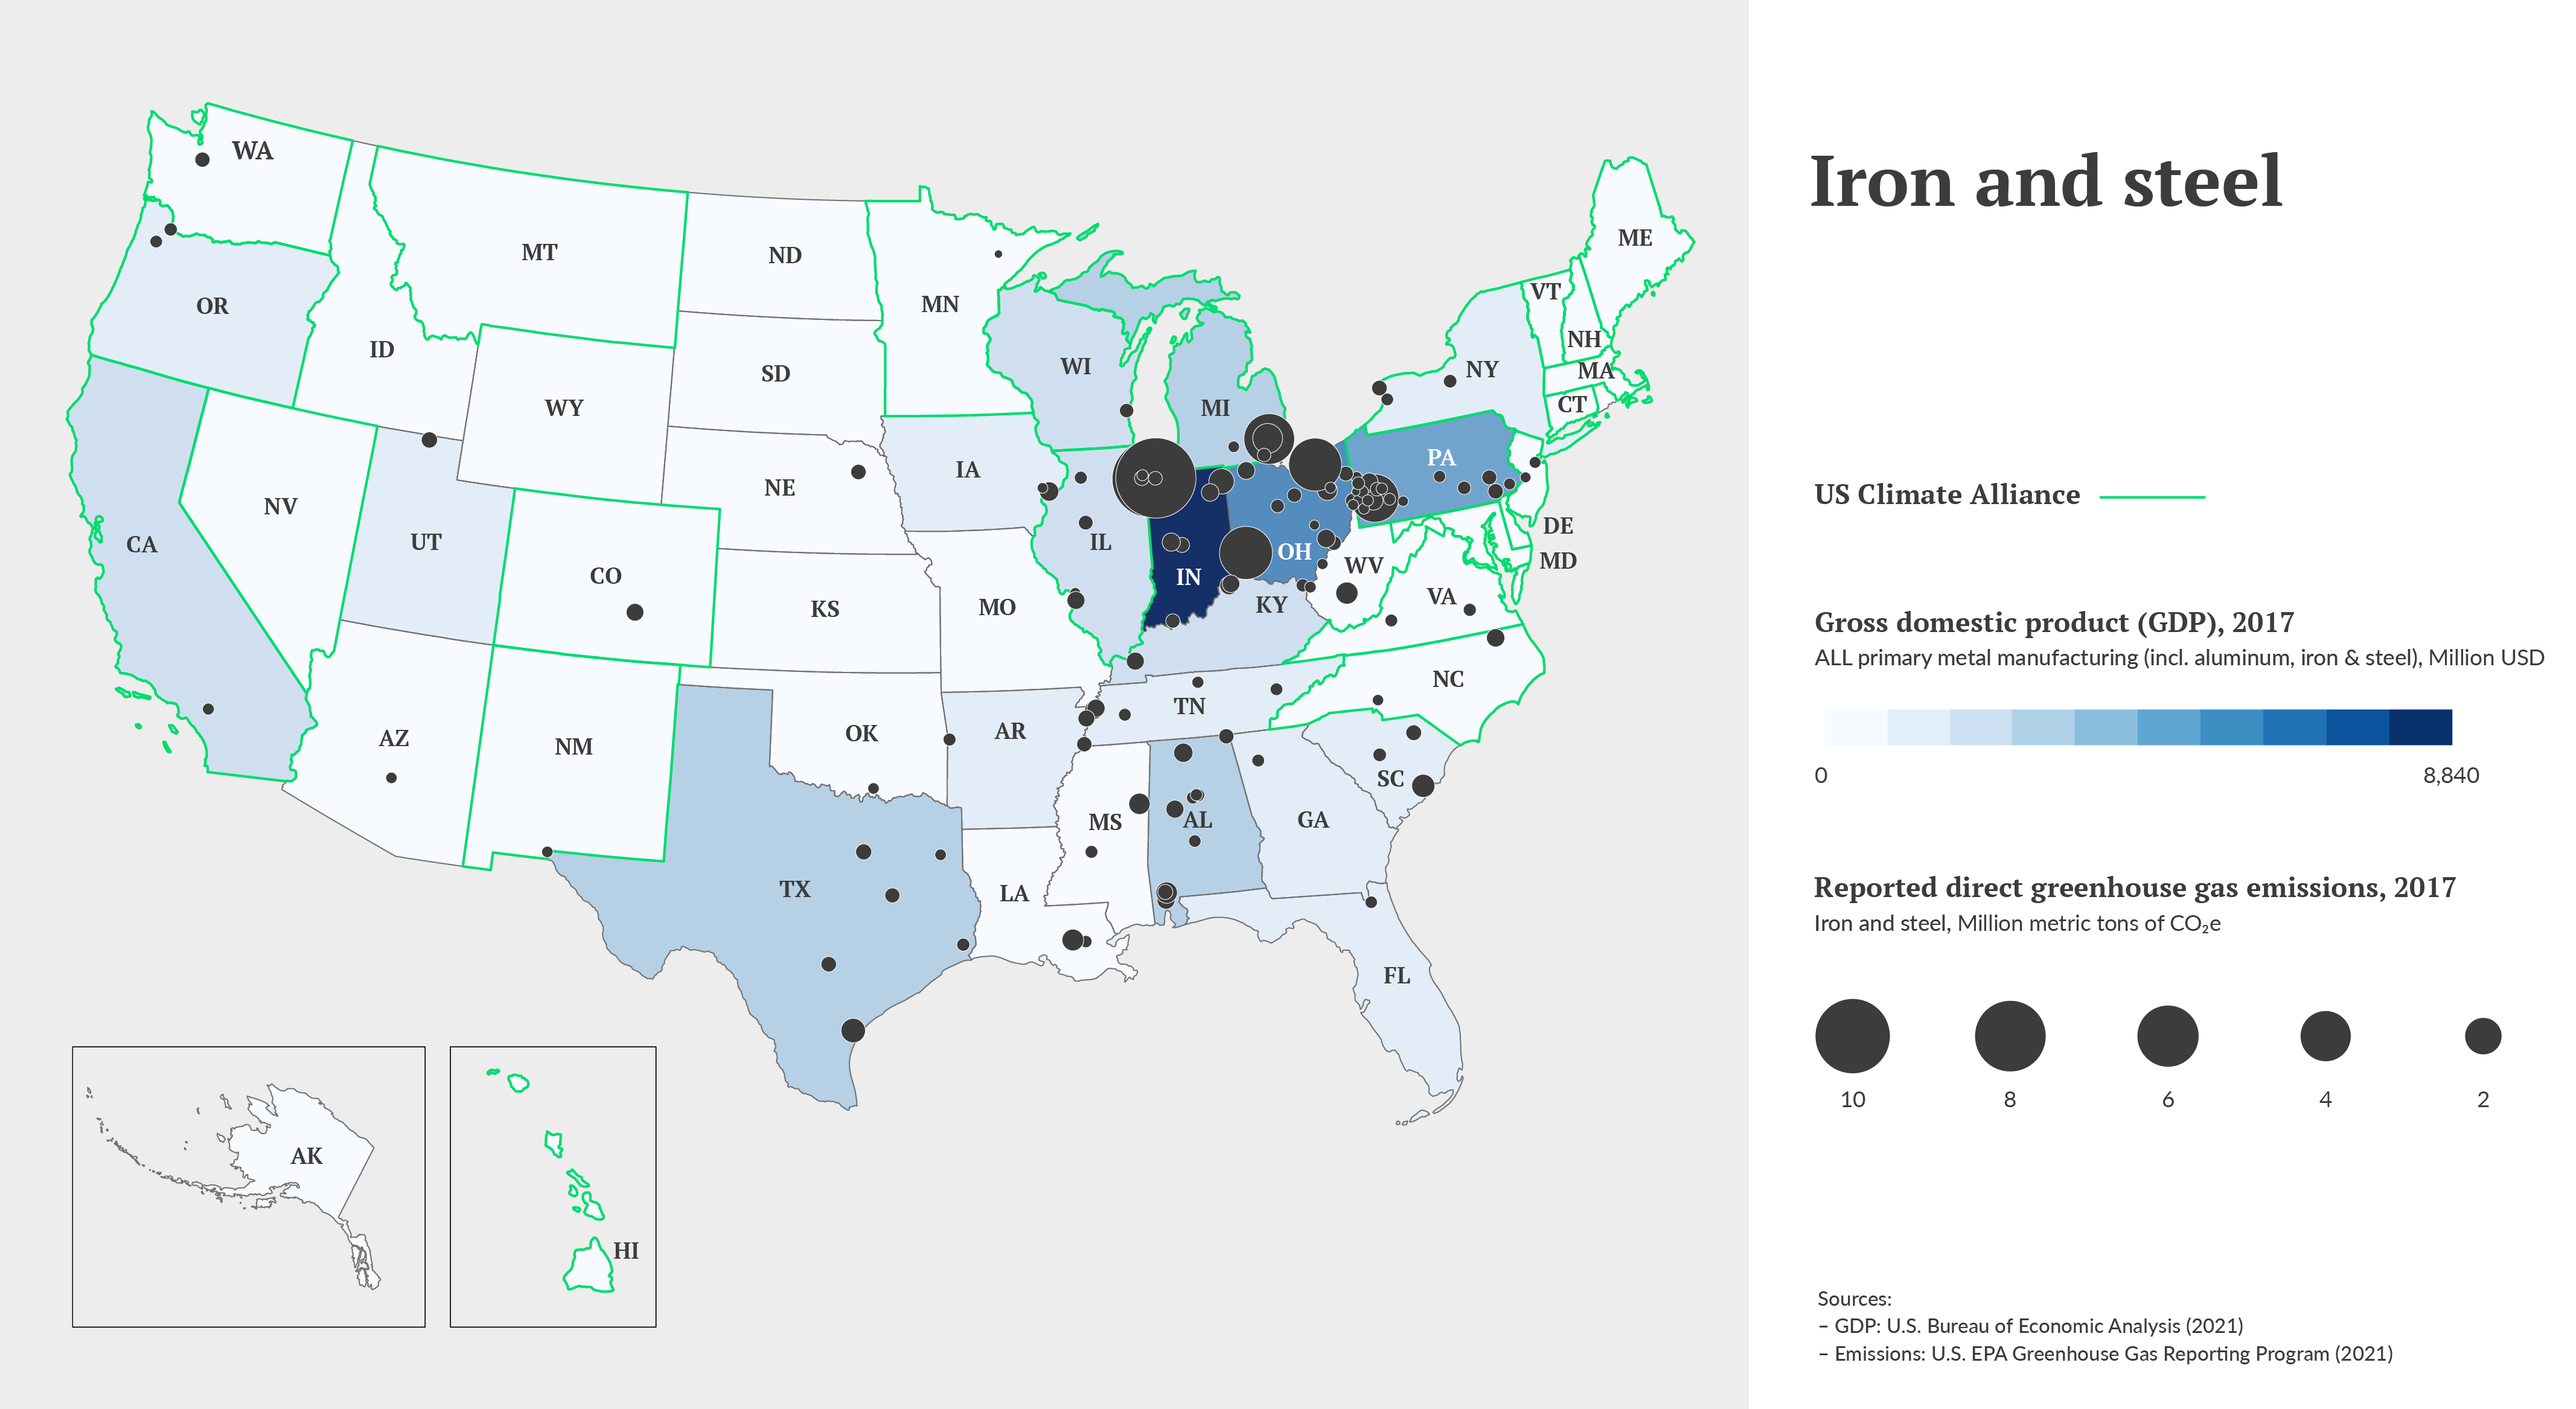
A total of 121 separate iron, steel, and ferroalloy manufacturing facilities reported emissions to the U.S. EPA’s Greenhouse Gas Reporting Program for 2018. Ownership of BF-BOF steel manufacturing is concentrated, with three companies operating integrated steel mills in nine locations. U.S. EAF steel plants are owned by 51 companies producing crude steel at 98 mini-mills (Krupnick 2020).
Iron and steel manufacturing employed around 82,000 people in 2018, according to the Bureau of Labor Statistics (U.S. Bureau of Labor Statistics 2021). The workforce is relatively skilled, with about 45% of the employees requiring qualifications beyond a high school diploma in 2018.
Relevant U.S. policies and initiatives
Although U.S. iron and steel producers are typically less carbon-intensive than their international counterparts, there are few, if any, voluntary or regulatory initiatives in the U.S. focused on achieving further decarbonization. Unlike for cement, for example, there is no Energy Star recognition, nor are there other industry-specific environmental product declaration programs, for iron and steel producers (Krupnick 2020). The American Iron and Steel Institute supports several sustainability initiatives, but does not have any active programs focused on decarbonization (American Iron and Steel Institute 2021).
Green procurement programs could help to incentivize lower-carbon production. The most prominent existing policy is California’s “Buy Clean California Act,” which requires state agencies to procure building materials whose embedded emissions do not exceed thresholds established by regulators. Because the public sector comprises a relatively small percentage of the market, public procurment programs may not be as effective as they are for other basic materials industries, like cement or aluminum (Krupnick 2020). Voluntary programs, like the U.S. Green Building Council’s LEED rating system (U.S. Green Building Council 2021), may also incentivize procurement of lower-carbon steel in building construction.
Aluminum
Industry size
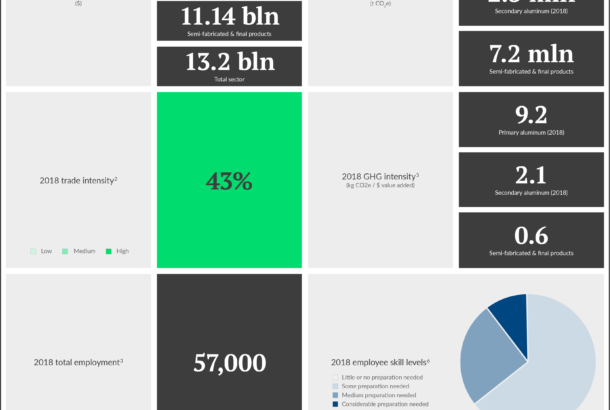
Historically, the U.S. used to be the world’s largest producer of primary aluminum. Since 2000, however, absolute and relative production have declined; in 2019 the U.S. was the ninth largest producer, providing 1.7% of total world production (around 1.1 million tons) (USGS 2021). Total U.S. primary aluminum production in 2020 was about 1 million tons. Secondary aluminum production (produced from recycled scrap) was about 3.2 million tons. About 53% of this amount came from “new” (manufacturing) scrap and 47% from “old” (post-consumer) scrap (USGS 2021). In 2018, primary aluminum production generated $0.87 billion of value added, secondary production generated $1.16 billion, and semi-fabricated and final products generated $11.14 billion, for a total aluminum sector value added of $13.2 billion.
Carbon intensity
The U.S. aluminum industry is less of a contributor to total GHG emissions than other basic materials industries, partly because of its smaller size. However, aluminum production is highly energy-intensive. Primary aluminum production relies heavily on electricity (for electrolysis), which is a large component of production cost. As a result, smelters have typically been located in parts of the country with lower electricity prices, dominated by hydroelectric power (such as in the Pacific Northwest) or coal-fired power (in the Midwest and Southeast, where the largest currently operating plants are located). Secondary aluminum production, which relies on recycled aluminum, is much less electricity-intensive, typically using only one tenth of the power required for primary production (The Aluminum Association 2013).
The electrolytic process used to produce aluminum, however, also typically results in direct CO2 emissions as well as direct emissions of perfluorocarbons (PFCs). Methane emissions can also be significant (around 4% of total CO2-equivalent emissions for primary aluminum). All told, direct GHG emissions account for around 42% of the net global warming impact of primary aluminum production (The Aluminum Association 2013).
Primary aluminum production in the U.S. (including alumina refining, electrolysis, and casting) had a carbon intensity of around 9.1 kg CO2e / $ value added in 2018. Secondary production had a lower – yet still significant – carbon intensity of 3.6 kg CO2e / $ value added. Data for 2014 suggest the carbon intensity associated with final aluminum product manufacturing was much lower, around 0.7 kg CO2e / $ value added (for this segment of the industry, emissions arise primarily from energy use).
Figure 3. Aluminum
Trade intensity
Overall, the aluminum industry is highly trade exposed. U.S. primary aluminum manufacturers, for example, rely almost exclusively on imports for raw material (primarily bauxite). Significant amounts of scrap used in secondary manufacturing are also imported. Furthermore, the value of imports for crude aluminum and fabricated products amounted to 135% of the sector’s value added in 2018. Exports are also significant, amounting to 57% of U.S. producers’ value added in 2018. Trade intensity in 2018 was 43%. That said, Canada is by far the biggest trading partner, contributing to 50% of all imports (USGS 2021).
Industry structure, geographic distribution, and workforce composition
Primary aluminum production in the U.S. is highly concentrated. In 2020, three companies – Alcoa, Century Aluminum, and Magnitude 7 Metals – operated seven primary aluminum smelters in six states: Indiana, Kentucky, Missouri, New York, South Carolina, and Washington (USGS 2021). The only smelter in Washington (owned by Alcoa) was idled in May 2020 (Sengupta 2020). Of the remaining states, only New York is a member of the U.S. Climate Alliance; Alcoa owns the single plant there (Lindquist 2018).
Secondary manufacturing is more dispersed, with over 50 facilities operating in a wider number of states (Map 3). For secondary aluminum production and final and semi-fabricated products, larger companies include Noranda Alumina, Arconic Inc., Almatis, Wise Alloys, and Novelis. Together with the primary aluminum manufacturers, these companies account for 85% of total emissions reported under the U.S. EPA Greenhous Gas Reporting Program for the aluminum sector.
The aluminum sector employed around 58,000 people in 2018, according to the Bureau of Labor Statistics (2021). Overall, around 36% of sector jobs required qualifications beyond a high school diploma (breakdowns are not available by sub-sector).
Map 3. Geographical distribution
Relevant U.S. policies and initiatives
A lifecycle analysis conducted in 2013 for the Aluminum Association indicated that U.S. industry has significantly reduced the carbon intensity of primary aluminum production. Carbon intensity (in CO2-equivalent) declined 37% between 1990 and 2010 (The Aluminum Association 2013), including an 85% reduction in PFC emissions, and a 26% reduction in energy intensity relative to 1995. The reductions resulted in part from an industry partnership with the Environmental Protection Agency (EPA) to reduce PFC emissions. More recent performance data are unavailable.
No current federal or state policies expressly target GHG emissions from the aluminum sector. Notably, however, around 40% of U.S. domestic aluminum consumption is for the transportation sector (e.g., vehicle manufacture), with another 14% used in building construction (USGS 2021). Given that the public sector is a large purchaser of vehicles and buildings, public procurement “buy clean” policies could have a significant role in supporting renewed decarbonization efforts. The Aluminum Association has released a series of validated environmental product declarations (EPDs) that could facilitate implementation of these policies (The Aluminum Association 2021).
Chemicals
The diversity of the chemicals sector in the U.S. makes direct international comparisons for the whole industry difficult. Instead, the summary below provides general statistics, while noting the geographic distribution of the key industry segments that could be important for decarbonization efforts: petrochemicals, plastics materials and resins, nitrogenous fertilizers, and plastics and rubber products.
Industry size
The U.S. is the second largest chemical producer in the world, behind China, contributing to 14% of total global production (American Chemistry Council 2020). Businesses within the chemical industry – excluding pharmaceuticals – generated $256 billion in value added and $550 billion in total output in 2018, which was over 9% of total manufacturing sector GDP (U.S. Census Bureau 2021a). Petrochemicals, plastics materials and resins, and nitrogenous fertilizers together produced about 30% of this GDP, amounting to over 25% of the sector’s value added (U.S. Census Bureau 2021a). Plastics and rubber products manufacturers produced another $125 billion in value added in 2018 (on $251 billion of total shipments), above and beyond chemical industry output (U.S. Census Bureau 2021a).
The U.S. chemical industry as a whole – and petrochemicals in particular – is expected to grow over the next decade. According to the International Energy Agency, petrochemicals are an increasingly important source of global oil consumption, and the U.S. is expected to increase its global market share for ethylene production to 22% by 2025 (up from 20% in 2017) (International Energy Agency 2018). Petrochemical industry growth in the U.S has been spurred by the shale gas revolution, and one result of this development is that the U.S. currently controls around 40% of global capacity for producing ethane-based petrochemicals (International Energy Agency 2018).
Carbon intensity
In aggregate, the energy consumed by the U.S. chemical industry (excluding pharmaceuticals) produced approximately 260 million metric tons of CO2 emissions in 2018. Total energy-related carbon intensity was therefore around 1 kg CO2 per dollar of value added. Within subsectors, however, carbon intensity varies significantly.
N-fertilizers have the highest energy-related CO2 intensity, at nearly 3 kg CO2/$ value added. However, this understates the emissions impact of this sector, because it excludes process emissions. Total GHG emissions reported to the U.S. EPA Greenhouse Gas Reporting Program for N-fertilizer facilities amounted to 40.2 million tons CO2e in 2018 (U.S. Environmental Protection Agency 2021). This amounts to a GHG intensity of at least 8.4 t CO2e/$ value added.
Petrochemicals, plastics materials and resins, and plastics and rubber products each contributed to around 35 million tons of CO2 emissions from energy use in 2018. Carbon intensities for these industries vary due to differences in value added, which is greatest for plastics and rubber products.
Trade intensity
Overall, the U.S. chemical industry is highly trade exposed, with a trade intensity for all chemical sectors (excluding pharmaceuticals) of 40%. The finished plastics and rubbers product industry is similarly trade exposed, with a trade intensity of 30%. On balance, the U.S. is a net exporter (American Chemistry Council 2020). Within high-emitting segments of the chemical industry, plastics materials and resins and nitrogenous fertilizers both face high trade exposure, with trade intensities of 43% and 41%, respectively. Only the primary petrochemicals industry qualifies as having low trade exposure, with a trade intensity of 9%.
For all segments, the majority of international trade occurs within North America, although Europe is also a major trading partner (American Chemistry Council 2020).
Industry structure, geographic distribution, and workforce composition
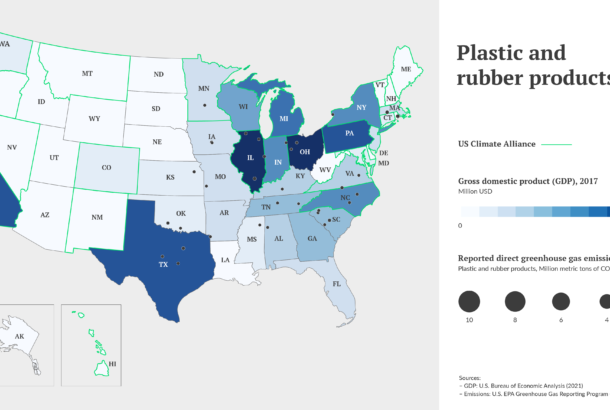
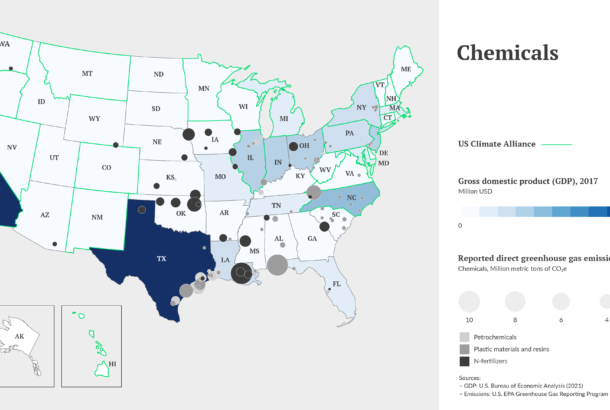
The U.S. chemical industry is diverse, with ownership structures that vary by segment. Industry-wide, the greatest concentration of chemical manufacturing facilities – and associated economic output – is in California, Texas, Ohio, Illinois, and Pennsylvania (CISA 2019). Of these, California, Illinois, and Pennsylvania are members of the U.S. Climate Alliance (Map 4). However, different industry segments are concentrated in different regions. Texas and Louisiana, for example, account for around 70% of all primary petrochemical production in the U.S. (CISA 2019). Nitrogenous fertilizer production is more dispersed, but with major production centers in the Midwest and South. Although California is a major chemical producer, most large-scale production in the state involves basic chemicals; no large facilities associated with petrochemicals, nitrogenous fertilizers, plastics materials and resins, or plastics and rubber products are located in California.
The chemical industry proper (excluding pharmaceuticals) employs over 500,000 workers, and the plastics and rubber products industry employs another 770,000 (U.S. Bureau of Labor Statistics 2021). Within the key “hard to abate” sectors, however, petrochemicals employs less than 10,000 people; plastics materials and resins employs approximately 72,000; and nitrogenous fertilizers employs only around 6,000 (U.S. Bureau of Labor Statistics 2021).
Figure 4. Chemicals
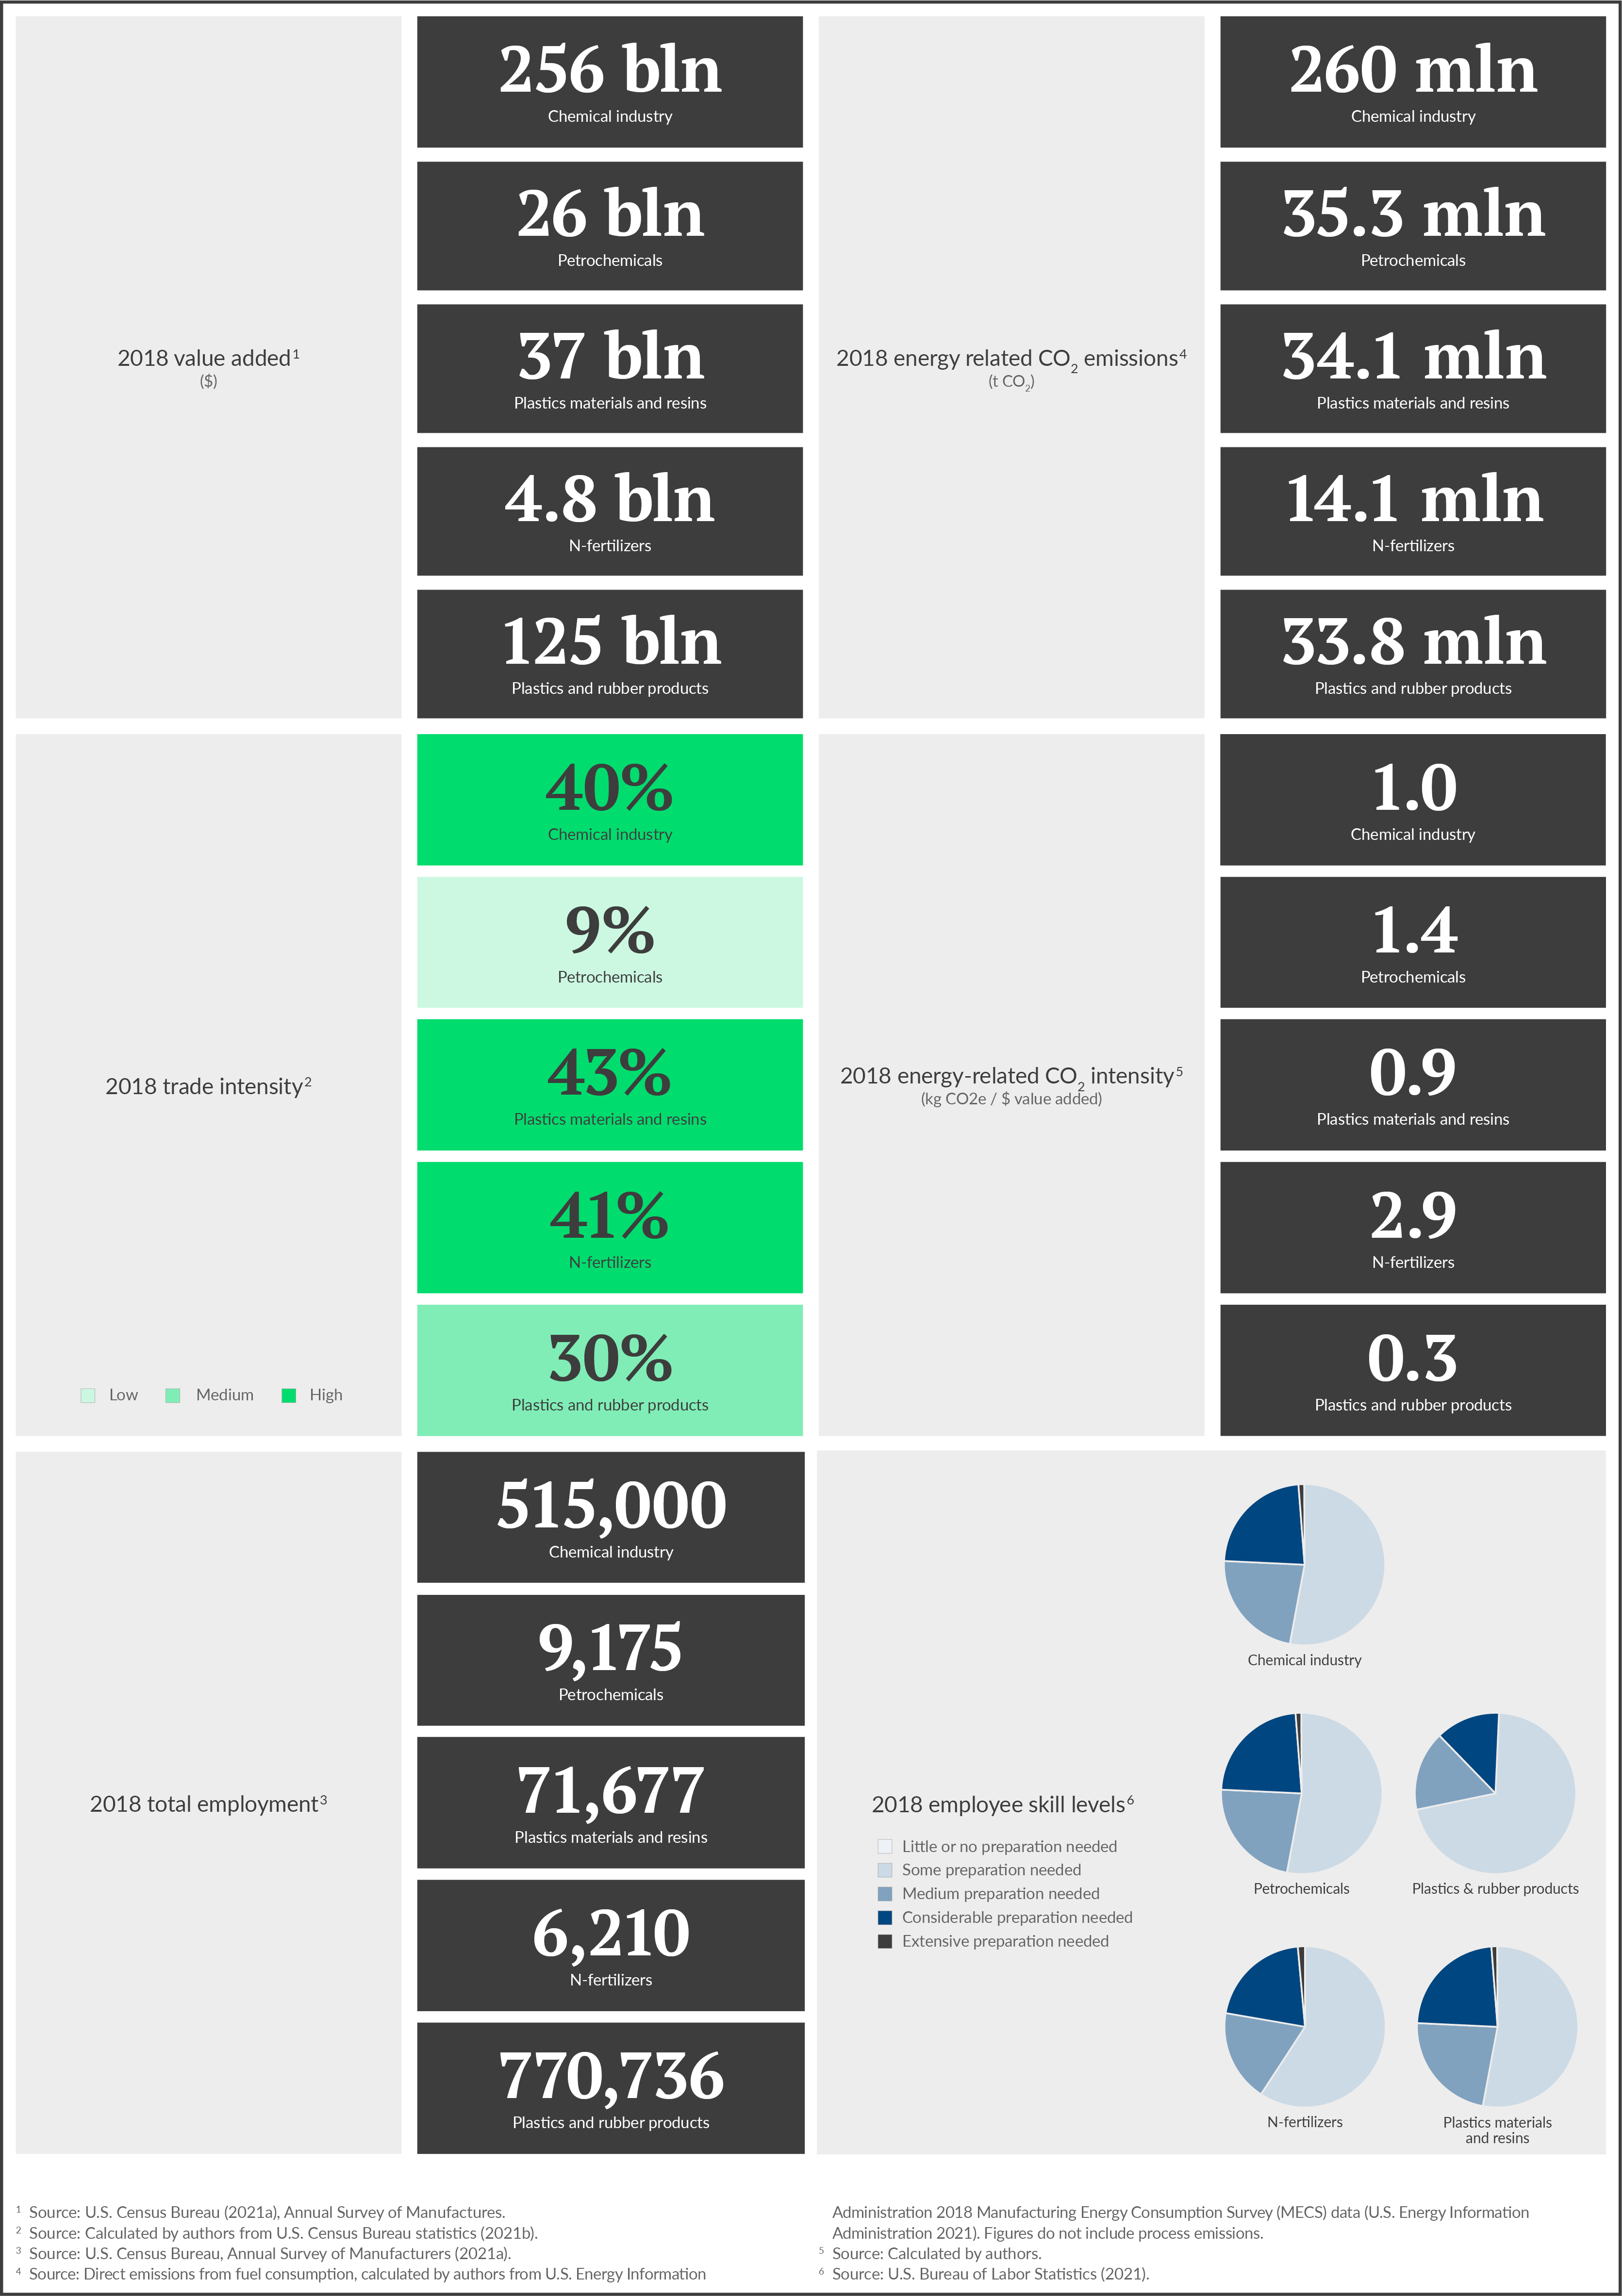
Required workforce development for the chemical industry varies somewhat by sector. In the basic chemicals (including petrochemicals) and the resin-rubbers-fibers industry groups, about 25% of jobs require considerable to extensive preparation (bachelor or post-graduate degree) (U.S. Bureau of Labor Statistics 2021). Somewhat less preparation is needed in the pesticide/fertilizer subsector, where 20% of jobs require bachelor or post-graduate degrees, and around 60% require only “some” preparation (U.S. Bureau of Labor Statistics 2021). Plastics and rubber products manufacturers require less preparation than the main chemical industries, with 70% of the workforce requiring only some preparation (equivalent to a high school degree) (U.S. Bureau of Labor Statistics 2021).
Relevant U.S. policies and initiatives
There are no current federal or state policy initiatives directly targeting chemical sector decarbonization.
Map 4. Geographical distribution of chemical industries
Map 5. Geographical distribution of plastic and rubber industries